
Page 72 - ΝΑΥΤΙΚΑ ΧΡΟΝΙΚΑ - ΣΕΠΤΕΜΒΡΙΟΣ 2022
P. 72
SHIPYARD INDUSTRY / RESEARCH
The type of ships on which the top 15 concentrate
South Korean groups Chinese groups
South Korea has strategically invested in becoming a top Chinese shipyards, like the Japanese, focus mainly on build-
choice for high-end newbuildings like tankers and LNG carri- ing bulk carriers. Of the 741 ships built for the Piraeus/Ath-
ers. 863 (or 74%) of the 1,166 fleet tankers built by the top 15 ens-managed fleet by the three Chinese groups listed among
were constructed by South Korean groups. The corresponding the top 15, 70% are bulk carriers.
figure for LNG carriers is 132 (or 96%). The Chinese groups have also played a significant role in
However, South Korean shipyards also have an extensive constructing the fleet’s containerships, as 30% of these were
shipbuilding portfolio and are highly active in the construc- built by Chinese groups.
tion of bulk carriers and containerships. On average, tanker
construction makes up 51% of the shipbuilding portfolio of The age profile of ships
the South Korean groups included in the top 15. The age distribution of the ships built by the top 15 does not
differ significantly from that of other ships in the Piraeus/
Japanese groups Athens-based fleet.
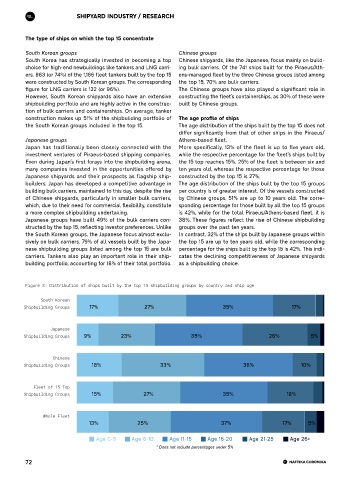
Japan has traditionally been closely connected with the More specifically, 13% of the fleet is up to five years old,
investment ventures of Piraeus-based shipping companies. while the respective percentage for the fleet’s ships built by
Even during Japan’s first forays into the shipbuilding arena, the 15 top reaches 15%. 25% of the fleet is between six and
many companies invested in the opportunities offered by ten years old, whereas the respective percentage for those
Japanese shipyards and their prospects as flagship ship- constructed by the top 15 is 27%.
builders. Japan has developed a competitive advantage in The age distribution of the ships built by the top 15 groups
building bulk carriers, maintained to this day, despite the rise per country is of greater interest. Of the vessels constructed
of Chinese shipyards, particularly in smaller bulk carriers, by Chinese groups, 51% are up to 10 years old. The corre-
which, due to their need for commercial flexibility, constitute sponding percentage for those built by all the top 15 groups
a more complex shipbuilding undertaking. is 42%, while for the total Piraeus/Athens-based fleet, it is
Japanese groups have built 49% of the bulk carriers con- 38%. These figures reflect the rise of Chinese shipbuilding
structed by the top 15, reflecting investor preferences. Unlike groups over the past ten years.
the South Korean groups, the Japanese focus almost exclu- In contrast, 32% of the ships built by Japanese groups within
sively on bulk carriers. 79% of all vessels built by the Japa- the top 15 are up to ten years old, while the corresponding
nese shipbuilding groups listed among the top 15 are bulk percentage for the ships built by the top 15 is 42%. This indi-
carriers. Tankers also play an important role in their ship- cates the declining competitiveness of Japanese shipyards
building portfolio, accounting for 18% of their total portfolio. as a shipbuilding choice.
Figure 3: Distribution of ships built by the top 15 shipbuilding groups by country and ship age
South Korean
Shipbuilding Groups 17% 27% 35% 17%
Japanese
Shipbuilding Groups 9% 23% 35% 26% 5%
Chinese
Shipbuilding Groups 18% 33% 36% 10%
Fleet of 15 Top
Shipbuilding Groups 15% 27% 35% 18%
Whole Fleet
13% 25% 37% 17% 5%
Age 0-5 Age 6-10 Age 11-15 Age 16-20 Age 21-25 Age 26+
* Does not include percentages under 5%
72