
Page 82 - ΝΑΥΤΙΚΑ ΧΡΟΝΙΚΑ - MARTIOS 2023
P. 82
SMART SHIPPING / RESEARCH
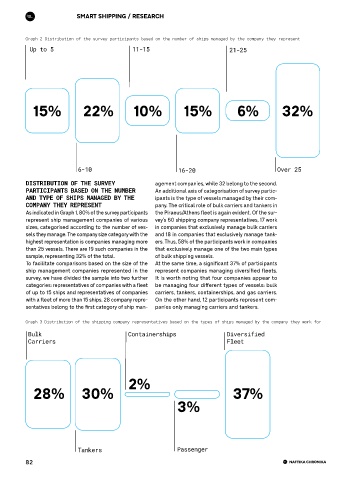
Graph 2 Distribution of the survey participants based on the number of ships managed by the company they represent
Up to 5 11-15 21-25
15% 22% 10% 15% 6% 32%
6-10 16-20 Over 25
DISTRIBUTION OF THE SURVEY agement companies, while 32 belong to the second.
PARTICIPANTS BASED ON THE NUMBER An additional axis of categorisation of survey partic-
AND TYPE OF SHIPS MANAGED BY THE ipants is the type of vessels managed by their com-
COMPANY THEY REPRESENT pany. The critical role of bulk carriers and tankers in
As indicated in Graph 1, 80% of the survey participants the Piraeus/Athens fleet is again evident. Of the sur-
represent ship management companies of various vey’s 60 shipping company representatives, 17 work
sizes, categorised according to the number of ves- in companies that exclusively manage bulk carriers
sels they manage. The company size category with the and 18 in companies that exclusively manage tank-
highest representation is companies managing more ers. Thus, 58% of the participants work in companies
than 25 vessels. There are 19 such companies in the that exclusively manage one of the two main types
sample, representing 32% of the total. of bulk shipping vessels.
To facilitate comparisons based on the size of the At the same time, a significant 37% of participants
ship management companies represented in the represent companies managing diversified fleets.
survey, we have divided the sample into two further It is worth noting that four companies appear to
categories: representatives of companies with a fleet be managing four different types of vessels: bulk
of up to 15 ships and representatives of companies carriers, tankers, containerships, and gas carriers.
with a fleet of more than 15 ships. 28 company repre- On the other hand, 12 participants represent com-
sentatives belong to the first category of ship man- panies only managing carriers and tankers.
Graph 3 Distribution of the shipping company representatives based on the types of ships managed by the company they work for
Bulk Containerships Diversified
Carriers Fleet
2%
28% 30% 37%
3%
Tankers Passenger
82